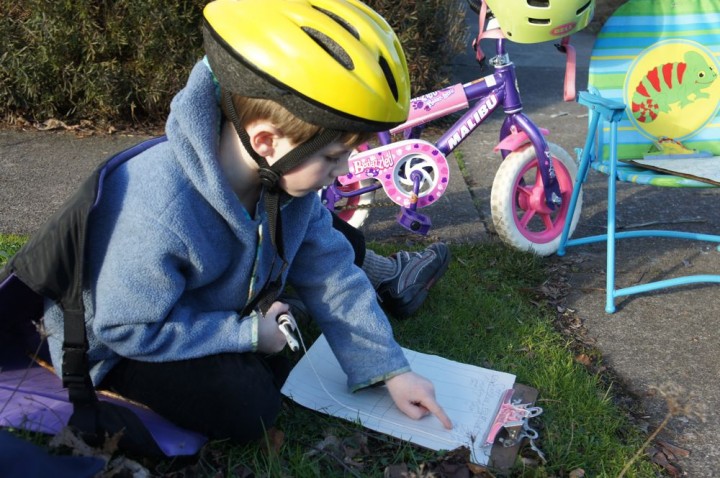
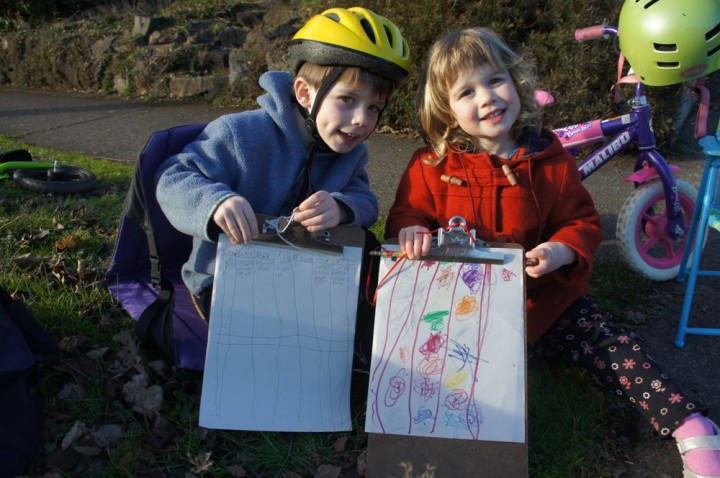
Eugene (and global climate change) gave us a sunny, dry Friday afternoon for a little scientific study. Recently, the kids and I were chatting about what color car is the most common. I suggested we come up with a little counting study. This afternoon, the kids made charts (Sylvan’s had some columns with colors written at the top: green, black, blue, red, brown, silvr, wite, and u for another) and hopped on their bikes to find out if silver really is the most common color car (actually, we hadn’t even ventured a guess or talked about hypotheses before we set out).
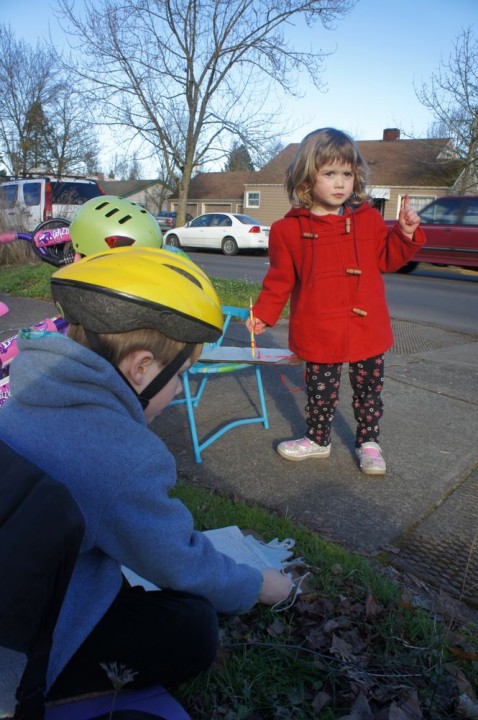
Once on the sidewalk, Miss E wanted to head west and Mr. S was hoping to venture south. Could we do both? Sylvan magnanimously suggested we go to Elena’s preferred corner first. We’d brought chairs, and, once we were comfortable and ready, I used my iPod timer to set 15 minutes. Then, the craziness began. That first corner was 22nd and Hilyard, which has a traffic light just two blocks south. When the light turned green, I’d say, “Okay, head down, Sylvan. Ready?” Then I’d call out, “blue, silver, silver, white, black, white, silver, red, blue, black, black, black,” and hope that he got it. “Can you just remember them, Mom?” Um, no.

Elena, independently, figured out her own system, and, while she didn’t really get a complete sample, she did pay attention and fill in her chart.

Then we biked to the second corner counted for another 15 minutes. While we didn’t have the same rushes of cars, the steady stream at 24th and Harris was challenging to keep up with. And we had to keep saying hi to all the folks we knew (1 in a car, 3 on bikes).
The final tally:
- 6+12 green=18 green
- 33+36 black=69 black
- 21+11 blue=32 blue
- 24+15 red=39 red
- 2+3 brown=5 brown
- 41+31 silver=72 silver
- 38+32 white=70 white (includes city buses, of which there were 3 or 4)
- 2+10 other=12 other
- 167 cars at Hilyard/22nd; 150 at 24th/Harris
Silver it is. Blue may have been under-represented and counted as black in the second count (21 vs. 11) because we were squinting into the sun the second time around. We didn’t count any parked cars, by the way.
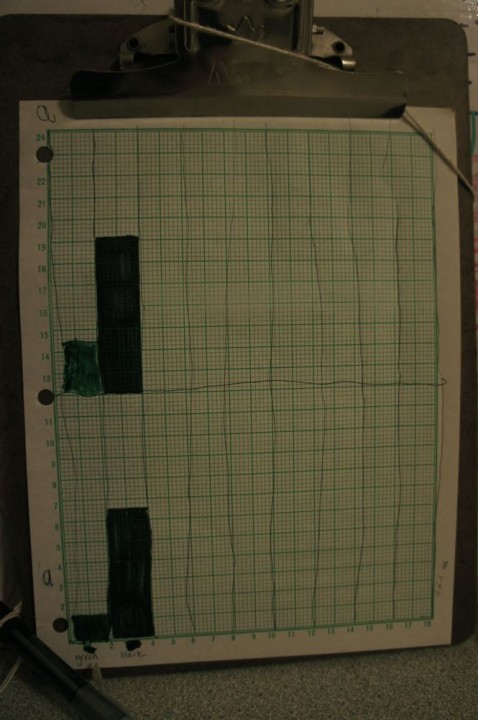
Sylvan started to make a histogram after dinner. I’m not sure he’ll have the staying power to finish it, but here it is in its nascence.

Beginning of a car color histogram, broken out by study location
If we were to do this study again, I’d suggest putting the chart together with some rhyme or reason to it to make recording simpler. I’d also add a “gray” column. Lots of gray cars were counted as black. And I’d add a bicycle column, just because I’m interested.

Happy scientific creativity
awesome charts, great going!!!!!!
I love this, and the whole Science Friday idea! I’ve already started book clubs with my niece and nephew and now may have to begin a science club with them too (clubs meaning just me and them – we are an exclusive bunch). 🙂